ශ්රී ලංකා ප්රජාතාන්ත්රික සමාජවාදී ජනරජයේ තානාපති කාර්යාලය - බ්රසීලියාව, බ්රසීලය
இலங்கை ஜனநாயக சோஷலிசக் குடியரசின் தூதரகம் - பிரசீலியா, பிரேசில்
Embassy of the Democratic Socialist Republic of Sri Lanka - Brasilia, Brazil

Peru: Economic & Trade
Economic and Social Indicators – Peru and Sri Lanka
| Peru | Sri Lanka | |
|---|---|---|
| Official Name | Republic of Peru | Democratic Socialist Republic of Sri Lanka |
| Area | Western South America, bordering the South Pacific Ocean, between Chile and Ecuador | 65,610 Sq. Km |
| Capital | Lima | Sri Jayewardenepura Kotte |
| Population | 32,600,249 (2024 est.) | 21,982,608 (2024 est.) |
| Life Expectancy | 68.9 years (2024 est.) | 76.8 years (2024 est.) |
| Literacy | 94.5% (2020) | 93% (2020) |
| Ethnic Groups | Mestizo (mixed Amerindian and White) 60.2%, Amerindian 25.8%, White 5.9%, African descent 3.6%, other (includes Chinese and Japanese descent) 1.2%, unspecified 3.3% (2017 est.) | Sinhalese 74.9%, Sri Lankan Tamil 11.2%, Sri Lankan Moors 9.3%, Indian Tamil 4.1%, Other 0.5% (2012) |
| Religions | Roman Catholic 66.4%, Protestant 22.4% (Evangelical 19.6%, other Protestant 1.3%), other 1.9%, agnostic/atheist none 6.8%, unspecified 1.2% (2023 est.) | Buddhist 70.1%, Hindu 12.6%, Muslim 9.7%, Christian and Roman Catholic 7.6% (2012) |
| GDP | US$ 517.644 billion (2023 est.) | US$ 84.36 billion (2023) Source World Bank |
| GDP - Rate | -0.55% (2023 est.) | -2.3% (2023) Source World Bank |
| GDP - Per Capita | US$ 6,126.1 (2020) Source World Bank | US$ 3,827.96 (2023) Source World Bank |
| GDP Composition by Sector | Agriculture: 7.6% (2017 est.); Industry: 32.7% (2017 est.); Services: 59.9% (2017 est.) | Agriculture: 8.3% (2023 est.); Industry: 25.6% (2023 est.); Services: 59.9% (2023 est.) |
| Labor Force | 3.421 million (2020 est.) | 8.707 million (2023 est.) |
| Labor Force - By Occupation | Agriculture: 7.1%; Industry: 35%; Services: 49.6% (2022 est.) | Agriculture: 26.5% (2023) Source DCS; Industry: 25.3% (2023) Source DCS; Services: 48.2% (2023) Source DCS |
| Unemployment Rate | 4.82% (2023 est.) | 4.3% (2023 est.) Source DCS |
| Inflation Rate | 6.46% (2023 est.) | 16.54% (2023 est.) |
| Agriculture Products | Sugarcane, Potatoes, Rice, Bananas, Milk, Maize, Chicken, Oil palm fruit, Cassava, Grapes (2023) | Rice, Coconuts, Plantains, Tea, Sugarcane, Milk, Cassava, Fiber Crops, Maize, Chicken (2022) |
| Industries | Mining and refining of minerals; Steel, Metal fabrication; Petroleum extraction and refining, Natural gas and natural gas liquefaction; Fishing and fish processing, Cement, Glass, Textiles, Clothing, Food processing, Beer, Soft drinks, Rubber, Machinery, Electrical machinery, Chemicals, Furniture | Processing of rubber, Tea, Coconuts, Tobacco and other agricultural Commodities; Tourism; Clothing and textiles; Mining |
| Export – Merchandise | US$ 35.79 billion (2020) Source World Bank | US$ 11.911 billion (2023) Source World Bank |
| Export – Merchandise & Services | US$73.326 billion (2023) Source World Bank | US$17.327 billion (2023) Source World Bank |
| Export Commodities | Copper ore, Gold, Refined copper, Refined petroleum, Grapes (2023) | Garments, Tea, Precious stones, Used rubber tires, Rubber products (2023) |
| Export Partners | China 34%, USA 14%, Canada 5%, India 4%, Switzerland 4% (2023) | USA 22%, India 7%, Germany 7%, UK 7%, Italy 5% (2023) |
| Imports | $62.99 billion (2023 est.) | $18.823 billion (2023 est.) |
| Imports Commodities | Refined petroleum, Crude petroleum, Cars, Trucks, Broadcasting equipment (2023) | Refined petroleum, Fabric, Crude Petroleum, Packaged medicine, Cotton fabric (2023) |
| Import Partners | China 26%, USA 21%, Brazil 7%, Argentina 5%, Mexico 3% (2023) | India 21%, China 19%, UAE 10%, Singapore 5%, Malaysia 4% (2023) |
Source: The World Fact book/ Central Bank of Sri Lanka/Sri Lanka Customs
1. Sri Lanka’s Exports, Imports, Total Trade & Balance of Trade with Peru
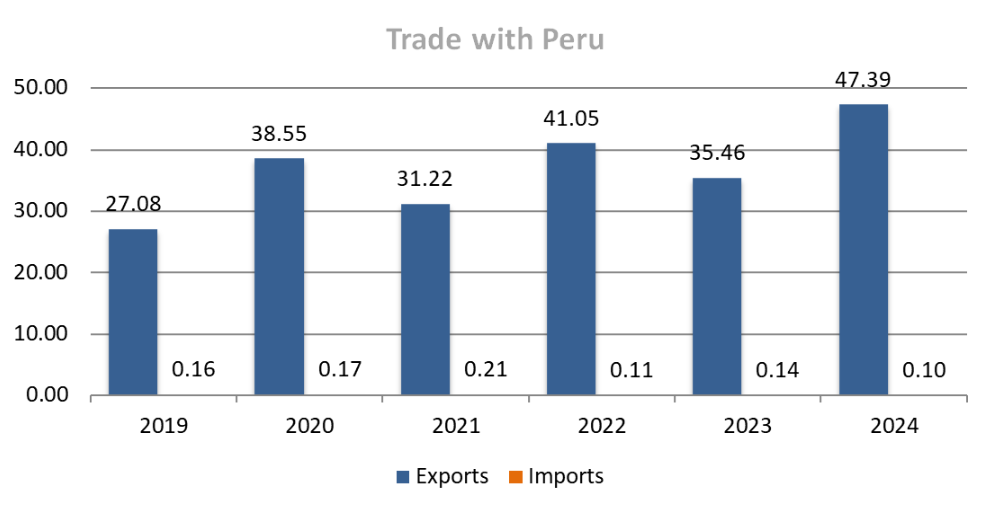
The total trade turnover between Sri Lanka and Peru, as shown in Table 1 below, has been erratic over the past six years.
Table 1: Trade with the Peru
Values in US $ Mn
| Year | Exports - Value | Exports - Growth(%) | Imports - Value | Imports - Growth(%) | Total Trade Turnover - Value | Total Trade Turnover - Growth(%) | Trade Balance | Import Coverage (%) |
| 2019 | 27.08 | - | 0.16 | - | 27.24 | - | 26.92 | 16,925.00 |
| 2020 | 38.55 | 42.35 | 0.17 | 8.08 | 38.72 | 42.15 | 38.38 | 22,292.94 |
| 2021 | 31.22 | -19.01 | 0.21 | 18.72 | 31.43 | -18.84 | 31.02 | 15,209.48 |
| 2022 | 41.05 | 31.49 | 0.11 | -44.52 | 41.17 | 30.99 | 40.94 | 36,044.94 |
| 2023 | 35.46 | -13.62 | 0.14 | 18.82 | 35.60 | -13.53 | 35.33 | 26,205.06 |
| 2024 | 47.39 | 33.62 | 0.10 | -29.14 | 47.49 | 33.39 | 47.29 | 49,413.91 |
| 2024 (Jan -Nov) | 41.92 | - | 0.08 | - | 42.01 | - | 41.84 | 50,644.69 |
| 2025 (Jan - Nov) | 20.95 | 50.47 | 2.17 | 2,520.42 | 23.12 | -44.97 | 18.78 | 965.65 |
Source: Sri Lanka Customs
Sri Lanka’s exports to Peru fluctuated during the review period, reaching a peak of US$ 47.39 million in 2024. On the imports side, the value of imports from Peru to Sri Lanka remained minimal and erratic, recording the lowest value of US$ 0.10 million in 2024. The balance of trade has consistently been in favour of Sri Lanka.
Compared with January to November period of 2024, both Sri Lanka’s total exports to Peru and total imports from Peru increased by 50.47% and 2,520.42% respectively in 2025.
Sri Lanka’s exports to Peru
- Peru was the 41st export market for Sri Lanka in 2024, accounting for a share of 0.39%. In 1977, Peru ranked as Sri Lanka’s 53rd market, with a share of 0.10%.
- As shown in Table 2 below, cinnamon has become the dominant export item, representing 57.80% of the total value of Sri Lanka’s exports to Peru in 2024.
Table 2: Sri Lanka’s Major Export Items to Peru (2020-2024)
Values in US$ Mn.
| HS Code | Description | 2020 | 2021 | 2022 | 2023 | 2024 | Share in 2024 (%) | Change in 2024 over 2023 (%) |
|---|---|---|---|---|---|---|---|---|
| 0906 | Cinnamon and cinnamon-tree flowers | 28.74 | 17.96 | 26.98 | 23.41 | 27.39 | 57.80 | 17.00 |
| 530500 | Other vegetable textile fibres; | 0.84 | 4.98 | 7.31 | 5.72 | 14.25 | 30.08 | 149.28 |
| 61&62 | Apparel | 1.78 | 2.25 | 3.72 | 2.56 | 2.79 | 5.89 | 9.26 |
| 4015 | Articles of apparel and clothing accessories | 0.26 | 1.09 | 0.41 | 0.24 | 0.64 | 1.35 | 167.03 |
| 3802 | Activated carbon; | 0.03 | 0.32 | 0.10 | 1.05 | 0.63 | 1.34 | -39.84 |
| 15131111 | Virgin coconut oil | 0.02 | 0.15 | 0.48 | 1.01 | 210.68 | ||
| Others | 6.88 | 4.62 | 2.53 | 2.33 | 1.20 | 2.52 | -48.71 | |
| Total Exports | 38.55 | 31.22 | 41.05 | 35.46 | 47.39 | 100.00 | 33.62 |
Source: Sri Lanka Customs
Sri Lanka’s Imports from Peru
- Peru was the 123rd supplier to Sri Lanka in 2024.
- As shown in the Table 3 below, pharmaceutical products were the major import item, accounting for 54.02% of the total value of Sri Lanka’s imports from Peru in 2024.
Table 3: Sri Lanka’s Major Import Items from Peru (2020 –2024)
Values in US$ Mn.
| HS Code | Description | 2020 | 2021 | 2022 | 2023 | 2024 | Share in 2024 (%) | Change in 2024 over 2023 (%) |
|---|---|---|---|---|---|---|---|---|
| 30 | Pharmaceutical products | 0.04 | 0.04 | 0.02 | 0.08 | 0.05 | 54.02 | -31.89 |
| 90 | Optical, photographic, cinamatographic, measuring, checking, precision, medical or surgical instrument | 0.00 | 0.01 | 0.01 | 0.01 | 0.03 | 34.26 | 148.45 |
| 0709 | Other vegetables, fresh or chilled. | 0.00 | 0.01 | 11.04 | 572.51 | |||
| 11 | Products of the milling industry; malt; starches; | 0.00 | 0.00 | 0.00 | 0.00 | 0.41 | 80.97 | |
| Others | 0.14 | 0.15 | 0.09 | 0.04 | 0.00 | 0.28 | -99.40 | |
| Total Imports | 0.17 | 0.21 | 0.11 | 0.14 | 0.10 | 100.00 | -29.14 |
Source: Sri Lanka Customs
2. Scope for further expansion of Sri Lanka’s Exports to Peru
Considering the growing demand pattern in Peru and Sri Lanka´s sustainable supply capacities, the following products have potential for further expansion in the Peruvian market.
- Apparel
- New Pneumatic Tyres of Rubber
- Cloves
- Pepper
- Activated Carbon
- Tea
Additional Bilateral Trade Statistics
| Year | Rank | Value US. Mn. | % of total export to the world | Growth (Multiples) |
|---|---|---|---|---|
| 1977 | 53 | 00.73 | 0.11 | - |
| 2024 | 41 | 47.39 | 0.39 | 64.92 |
Source: Sri Lanka Customs
Note: Sri Lanka’s total exports to the world which stood at US$ 743 Mn. in 1977 has reached US$ 12, 017.03 Mn. in 2024, registering a 16-fold growth.
Additional Bilateral Trade Statistics
value in US$ Mn.
| Year | Export | Share of total export to the world (%) | Import | Total Trade | Balance of Trade |
|---|---|---|---|---|---|
| 1995 | 2.70 | 0.07 | 0.67 | 3.37 | 2.03 |
| 2000 | 3.17 | 0.06 | 0.84 | 4.01 | 2.33 |
| 2001 | 3.73 | 0.08 | 1.38 | 5.11 | 2.35 |
| 2002 | 2.66 | 0.06 | 1.21 | 3.87 | 1.45 |
| 2003 | 5.10 | 0.10 | 2.07 | 7.17 | 3.03 |
| 2004 | 2.36 | 0.04 | 1.01 | 3.37 | 1.35 |
| 2005 | 4.53 | 0.07 | 0.38 | 4.91 | 4.15 |
| 2006 | 4.98 | 0.07 | 0.84 | 5.82 | 4.14 |
| 2007 | 4.82 | 0.06 | 0.92 | 5.74 | 3.9 |
| 2008 | 6.89 | 0.08 | 1.01 | 7.9 | 5.88 |
| 2009 | 6.84 | 0.10 | 1.04 | 7.88 | 5.8 |
| 2010 | 7.45 | 0.09 | 0.32 | 7.77 | 7.13 |
| 2011 | 7.74 | 0.08 | 1.65 | 9.39 | 6.09 |
| 2012 | 13.45 | 0.14 | 8.30 | 21.75 | 5.15 |
| 2013 | 19.06 | 0.19 | 5.98 | 25.04 | 13.08 |
| 2014 | 15.00 | 0.13 | 1.48 | 16.48 | 13.52 |
| 2015 | 21.8 | 0.21 | 1.67 | 23.47 | 20.13 |
| 2016 | 19.02 | 0.18 | 1.27 | 20.29 | 17.75 |
| 2017 | 25.46 | 0.22 | 0.42 | 25.88 | 25.04 |
| 2018 | 33.93 | 0.29 | 0.16 | 34.09 | 33.77 |
| 2019 | 27.08 | 2.00 | 0.16 | 27.24 | 26.92 |
| 2020 | 38.55 | 0.39 | 0.17 | 38.72 | 38.88 |
| 2021 | 31.22 | 0.25 | 0.21 | 31.43 | 31.01 |
| 2022 | 41.05 | 0.32 | 0.11 | 41.17 | 40.94 |
| 2023 | 35.07 | 0.30 | 0.13 | 35.21 | 34.94 |
| 2024 | 47.39 | 0.39 | 0.10 | 47.49 | 47.29 |
Source: Sri Lanka Customs / Trade Map
Peru: Investments in Sri Lanka
As of 2024, there were no significant Foreign Direct Investments from Peru to Sri Lanka.
Tourism
- In 2024, Peru was 95th source of tourist arrivals to Sri Lanka.
- In 2020 and 2021, tourist arrivals from Peru decreased by 68.33 % and 81.05%, respectively, compared to the previous year due to the adverse effects of COVID-19 and the measures implemented to control its spread.
Tourist arrivals from Peru to Sri Lanka
| Year | Arrivals | Change % |
|---|---|---|
| 2018 | 301 | - |
| 2019 | 300 | -0.33 |
| 2020 | 95 | -68.33 |
| 2021 | 18 | -81.05 |
| 2022 | 87 | 38.33 |
| 2023 | 147 | 68.97 |
| 2024 | 247 | 68.03 |
Source: Sri Lanka Tourism Development Authority